Intermediate Level
Learn how to understand the UI
Intermediate Level Syllabus (Software)
Ready to learn how to make the most out of the software?
Software
- Wavelength view vs spectrum view
- Why the AID should be auto and scans to average should be 5
- Every feature on the Fraction Finder display
- Wavelengths settings and molecule dropdown
- How to determine head main bodies and tails during distillation
- What to look for during wiped film
- Updating to the newest software
___
1. Wavelength View vs Spectrum View
Understanding the Fraction Finder graphs starts with understanding the difference between Wavelength View and Spectrum View.
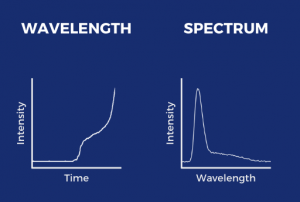
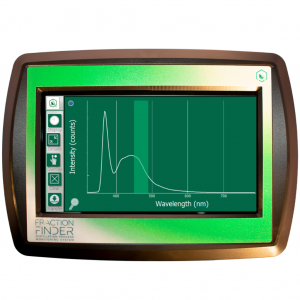
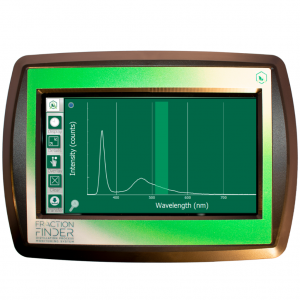
Wavelength View: This view tracks fractions as a function of time. It shows the “highlights” of the run. This is useful for tracking chemical oddities that occur at specific wavelengths. In general, the y-axis line indicates how much of that substance is present at that moment relative to earlier. This image depicts an increase in intensity (i.e. Main Body).
Spectrum View: This view tracks fractions as a function of wavelength. This view provides an instantaneous representation of current spectral state. The x-axis indicates the molecule that is being detected; different molecules will rise at different wavelengths. This image depicts Delta-9 rising right after our sharp internal reference peak.
2. Why the AID should be auto and scans to average should be 5
In every Fraction Finder quick start or user manual – regardless of the application – the first steps to setting up the Fraction Finder software are to go into Settings and do two things: (1) set Auto Integration Time (AID) to Auto; and (2) set Scans to Average to 5. This is recommended because it will optimize signal readings.
AID: Auto integration ensures that the signal from the spectrometer is maximized. In other words, checking off Auto AID will allow the system to determine what is the best integration time to set the sensor to so that you can get the best signal
Scans to Average: This sets how many optical readings the sensor takes before plotting and displaying a result. More readings that are averaged imply less noise, but less information. Arometrix recommends that you select 5.
In the next section we will discuss all of the other features on the display.
3. Every feature on the Fraction Finder display
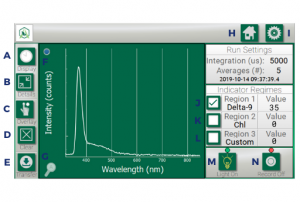
A. Display: Toggles between the two viewing options (Spectrum & Wavelength)
B. Details: Expands the graph and removes the data on the right-hand side
C. Overlay: Traces or “overlays” a peak of interest so you can compare it to a future peak
D. Clear: Clears an “overlay” that you no longer want to track
E. Transfer: Transfers recorded run data to a flash drive
F. Reference Peak Remover: Removes the internal reference/excitation peak from Spectrum view (only available in Version 1.2.3 or later)
G. Auto-Zoom: Returns zoom view to normal. You can zoom with 1 finger by drawing a bounding box.
H. Home: Returns you to the Home if you are in Settings
I. Settings: Allows you to adjust settings, such as Auto Integration Time, Scans to Average, and the Wavelength Tracker
J. Region 1-3 Checkboxes: Use only when in Wavelength view – By checking this box, it will populate the Wavelength plot with the corresponding molecule. This setting can be adjusted in Settings.
K. Region 2 Checkbox: See I.
L. Region 3 Checkbox: See I.
M. Light on/off: Turns the light on. This toggles between states.
N. Record on/off: Turns the recording mode on. This toggles between states.
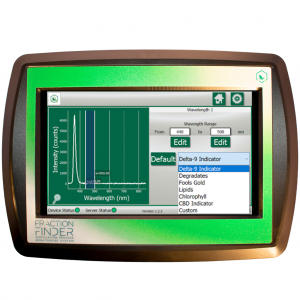
4. Wavelength Settings and Molecule Dropdown
In the Fraction Finder Setting (gear icon in the top-right corner), you can control the settings for the Wavelength Trackers via the Molecule Dropdown.
Users can track three wavelengths at a time. The use case will vary by process and by preference. By touching the checkmark box for a specified region, the display will automatically highlight the corresponding region.
Below is an example.
These Wavelength regions will come with manufacturer defaults; however, you can edit the From and To how you see fit. Click “Default” to return back to manufacturer default. Next to the “Default” button, you will see, a molecule dropdown. When you press the Molecule Indicator dropdown, you will see different molecule tracking options. You can select any of them, or set your own “Custom” molecule and region.
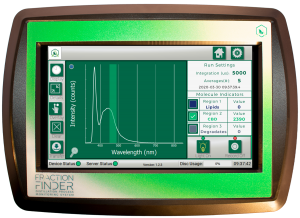
5. How to determine the head, main body, and tail during distillation
Determining fraction changes during distillation is what the Fraction Finder was initially designed for. Since its release, we have integrated it into other processes, such as Wiped Film Evaporation and Ethanol and Centrifuge Extractions.
Before we start reviewing Fraction Finder data for those other processes (Expert level), it’s important we cover the basic use case: using the Fraction Finder to distinguish Heads, Main Bodies, and Tails during short path distillation.
There is no signal during the Head fraction because terpenes don’t fluoresce on the Fraction Finder. Only the excitation/reference peak will show.
There is an uptick in signal at around 460 nm during Main Bodies because the Fraction Finder is sensitive to Cannabinoids such as CBD.
There is a shift to the right to around 490/500 nm in signal during Tails for Degradates.
Review the spectral data in this graph and the information in it for a more detailed description.
6. What to look for during wiped film evaporation
Every Wiped Film process is different, which makes it difficult to compile a one-size-fits-all description. Review our Fraction Finder for Wiped Film Evaporation guide for an overview, using an example of a Delta-9 THC distillation.
7. Updating to the newest software
Updating to the newest software is a ~10 minute process. Simply locate the Firmware zip file on our website. Download it. Plug in a thumb drive to your computer. Finally, plug the same thumb drive to the bottom of your (powered off) Fraction Finder display. Power your Fraction Finder display on and it will automatically register and update the software.
For a detailed description of this process, visit our Software Update page.
![]()
![]()
