
___
Coming Soon
Sign up below to beta test
Arometrix will reach out with the beta file.
Read Beta DAB App Instructions
___
What is the DAB App?
Data Analysis Breakdown
Best buds are important. Fraction Finder will have one very soon.
The DAB App is our upcoming Fraction Finder companion app.
See your molecular process data in hindsight for the first-time ever.
___
What can it do?
Fraction Finder data review
- Upload your Fraction Finder run data into the DAB App
- Review your entire Fraction Finder run set as a heat map / 2D Plot (NEW)
- Review your entire Fraction Finder run set on our Wavelength Plot
- Review any recorded spectra on its a Spectrum Plot
- Select any molecule to populate all plots with a highlight of where its fluorescence region is
- Select any combination of spectra and region via an interactive plot
Take a look at some screenshots below.
___
Here’s a preview
Run Example: Delta-9 Short Path Distillation Run
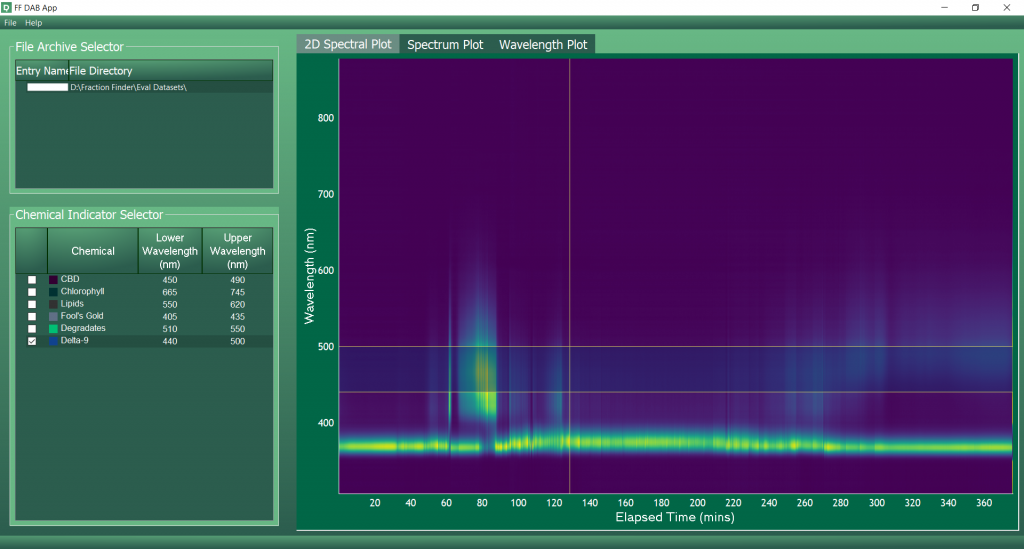
2D Spectral Plot Example #1: This 2D Spectral (heat) Plot shows the entire Delta-9 distillation run in one graph, tracking wavelength over time. Notice that only Delta-9 is checked off on the left-hand side, which highlights its wavelength region on the plot.
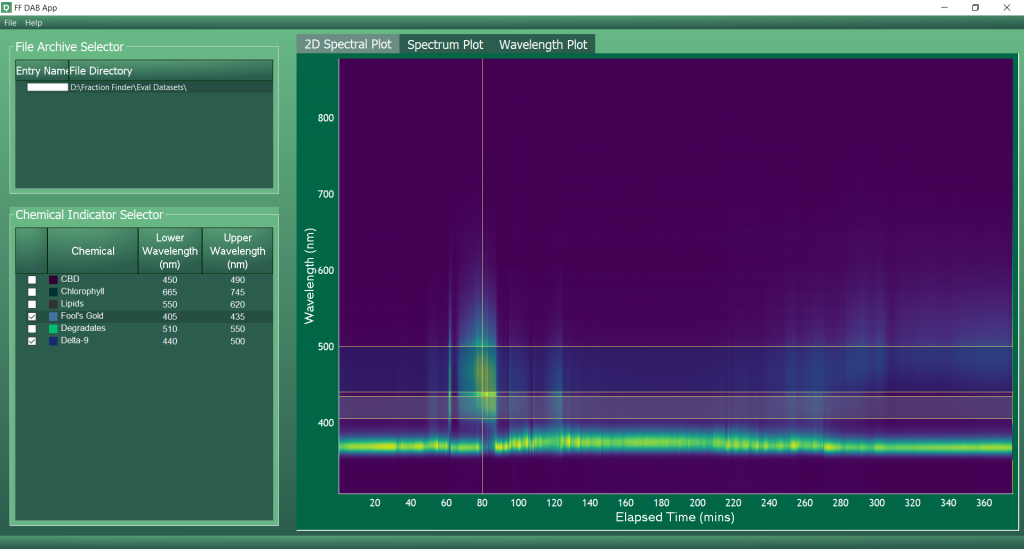
2D Spectral Plot Example #2: This 2D Spectral (heat) Plot shows the entire Delta-9 distillation run in one graph, tracking wavelength over time. Notice that Delta-9 and “Fool’s Gold” are both checked off on the left-hand side, which highlights its wavelength region on the plot.
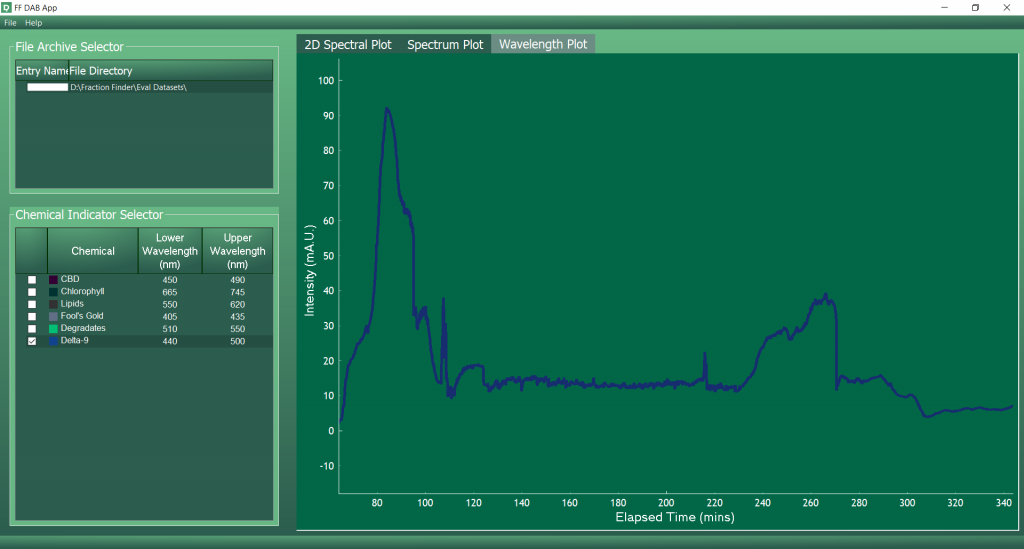
Wavelength Plot Example: This Wavelength Plot also shows the entire Delta-9 distillation run in one graph, tracking spectral Intensity over time. Notice that only Delta-9 is checked off on the left-hand side, which highlights its wavelength intensity throughout the entire run on the plot.
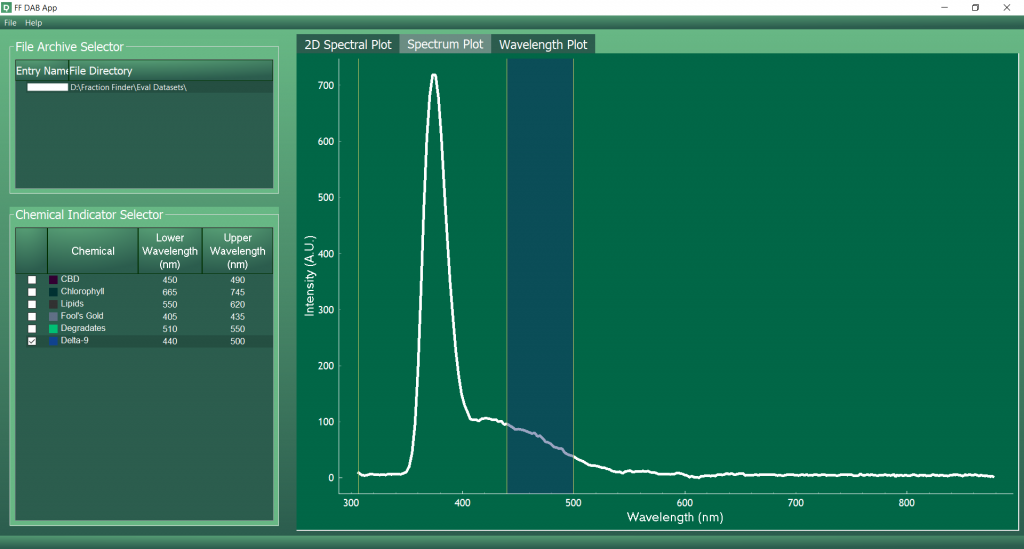
Spectrum Plot Example #1: This Spectrum Plot shows one moment of the Delta-9 distillation run in one graph, tracking spectral Intensity over Wavelength. Notice that only Delta-9 is checked off on the left-hand side, which highlights its wavelength region on the plot.
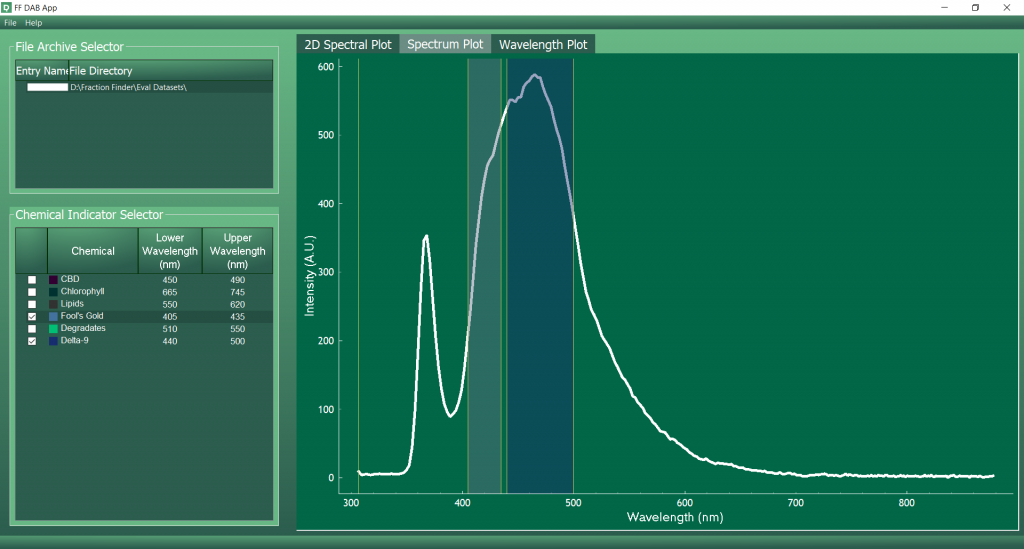
Spectrum Plot Example #2: This Spectrum Plot shows one moment of the Delta-9 distillation run in one graph, tracking spectral Intensity over Wavelength. Notice that both Delta-9 and “Fool’s Gold” are checked off on the left-hand side, which highlights its wavelength region on the plot.
Want to see a FULL graphical spectral progression of a Delta-9 short-path distillation run? Tap the button below.
![]()
![]()
![]()
